Visualization Badges: Communicating Design and Provenance through Graphical Labels Alongside Visualizations
This paper presents Visualization Badges, graphical labels shown alongside visualizations to communicate provenance and design considerations to enhance understandability and transparency. Badges may, for example, highlight a major finding, disclose that an axis has been truncated, or warn of possible visual artifacts. Inspired by nutrition and energy labels on product packaging, visualization badges aim (i) to allow visualization authors to justify and disclose analysis and design decisions and (ii) to make readers aware of important information when viewing and interpreting visualizations. Collectively, visualization badges aim to foster trust in visualizations and prevent readers from drawing incorrect conclusions. Based on a series of co-design workshops, we define and evaluate the concept of visualization badges and formulate a conceptual framework for analysis, application, and further research. Our framework includes a catalog of 132 visualization badges, categorization schemes, design options for their visual representations, applied visualization examples, and guidelines for their use. We hope that visualization badges will help communicate data and collectively improve communication, visualization literacy, and the quality of visualization techniques. Our badges, workshops, and guidelines can be found online https://vis-badges.github.io.
Publications
Project images
(click on any of the images for a high resolution version)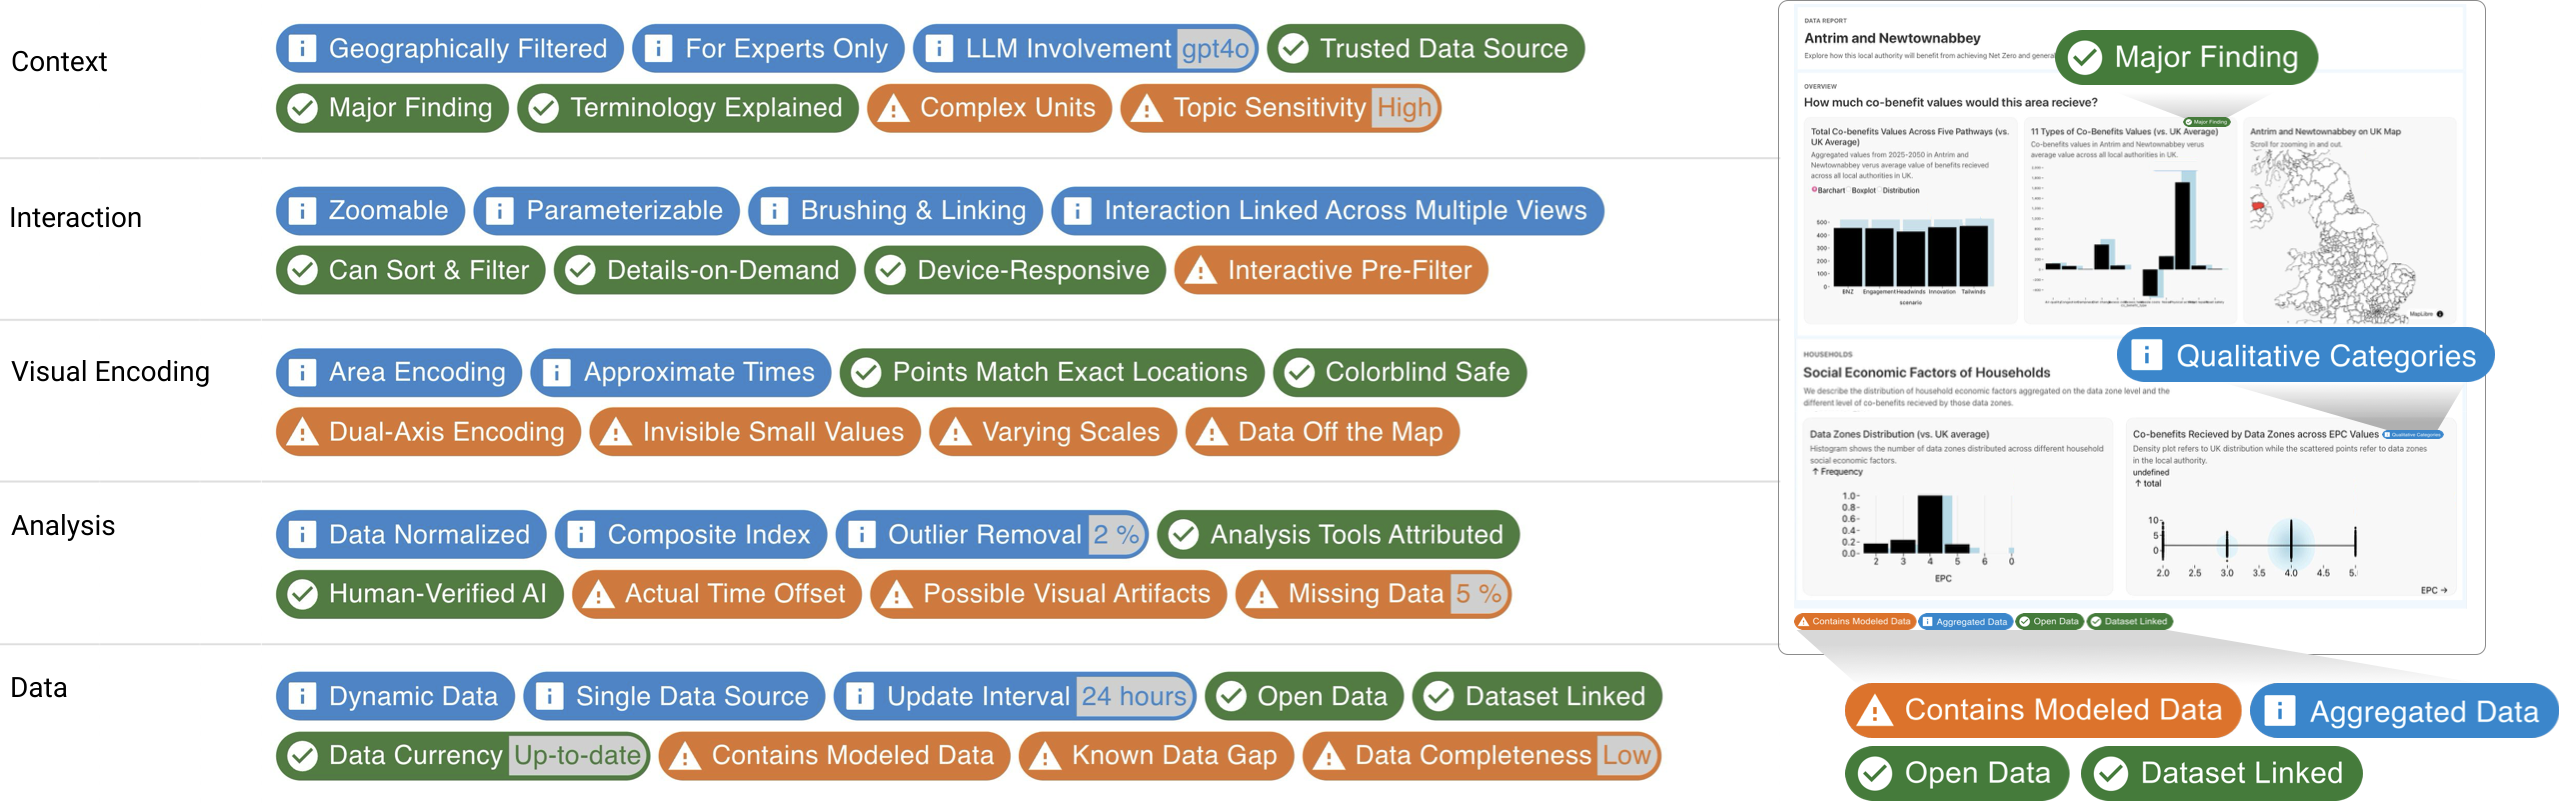
Visualization badges communicating design and provenance through graphical labels alongside visualizations.