From Statistics to Individuals: An Exploration of Zoomable Empathic Visualizations
Data visualization is a powerful tool for conveying statistical information, but when representing populations, it tends to hide individuals. We introduce Zoomable Empathic Visualizations (ZEVs), interactive experiences allowing users to smoothly navigate between abstract statistical visualizations and more qualitative, relatable representations focused on individuals. We present three use cases of ZEVs and report on a qualitative user study that highlights opportunities for deeper understanding and emotional engagement, while pointing to areas for improvement and further refinement. In summary, ZEVs point toward new approaches for revealing the individuals behind the data.
Publications
Project images
(click on any of the images for a high resolution version)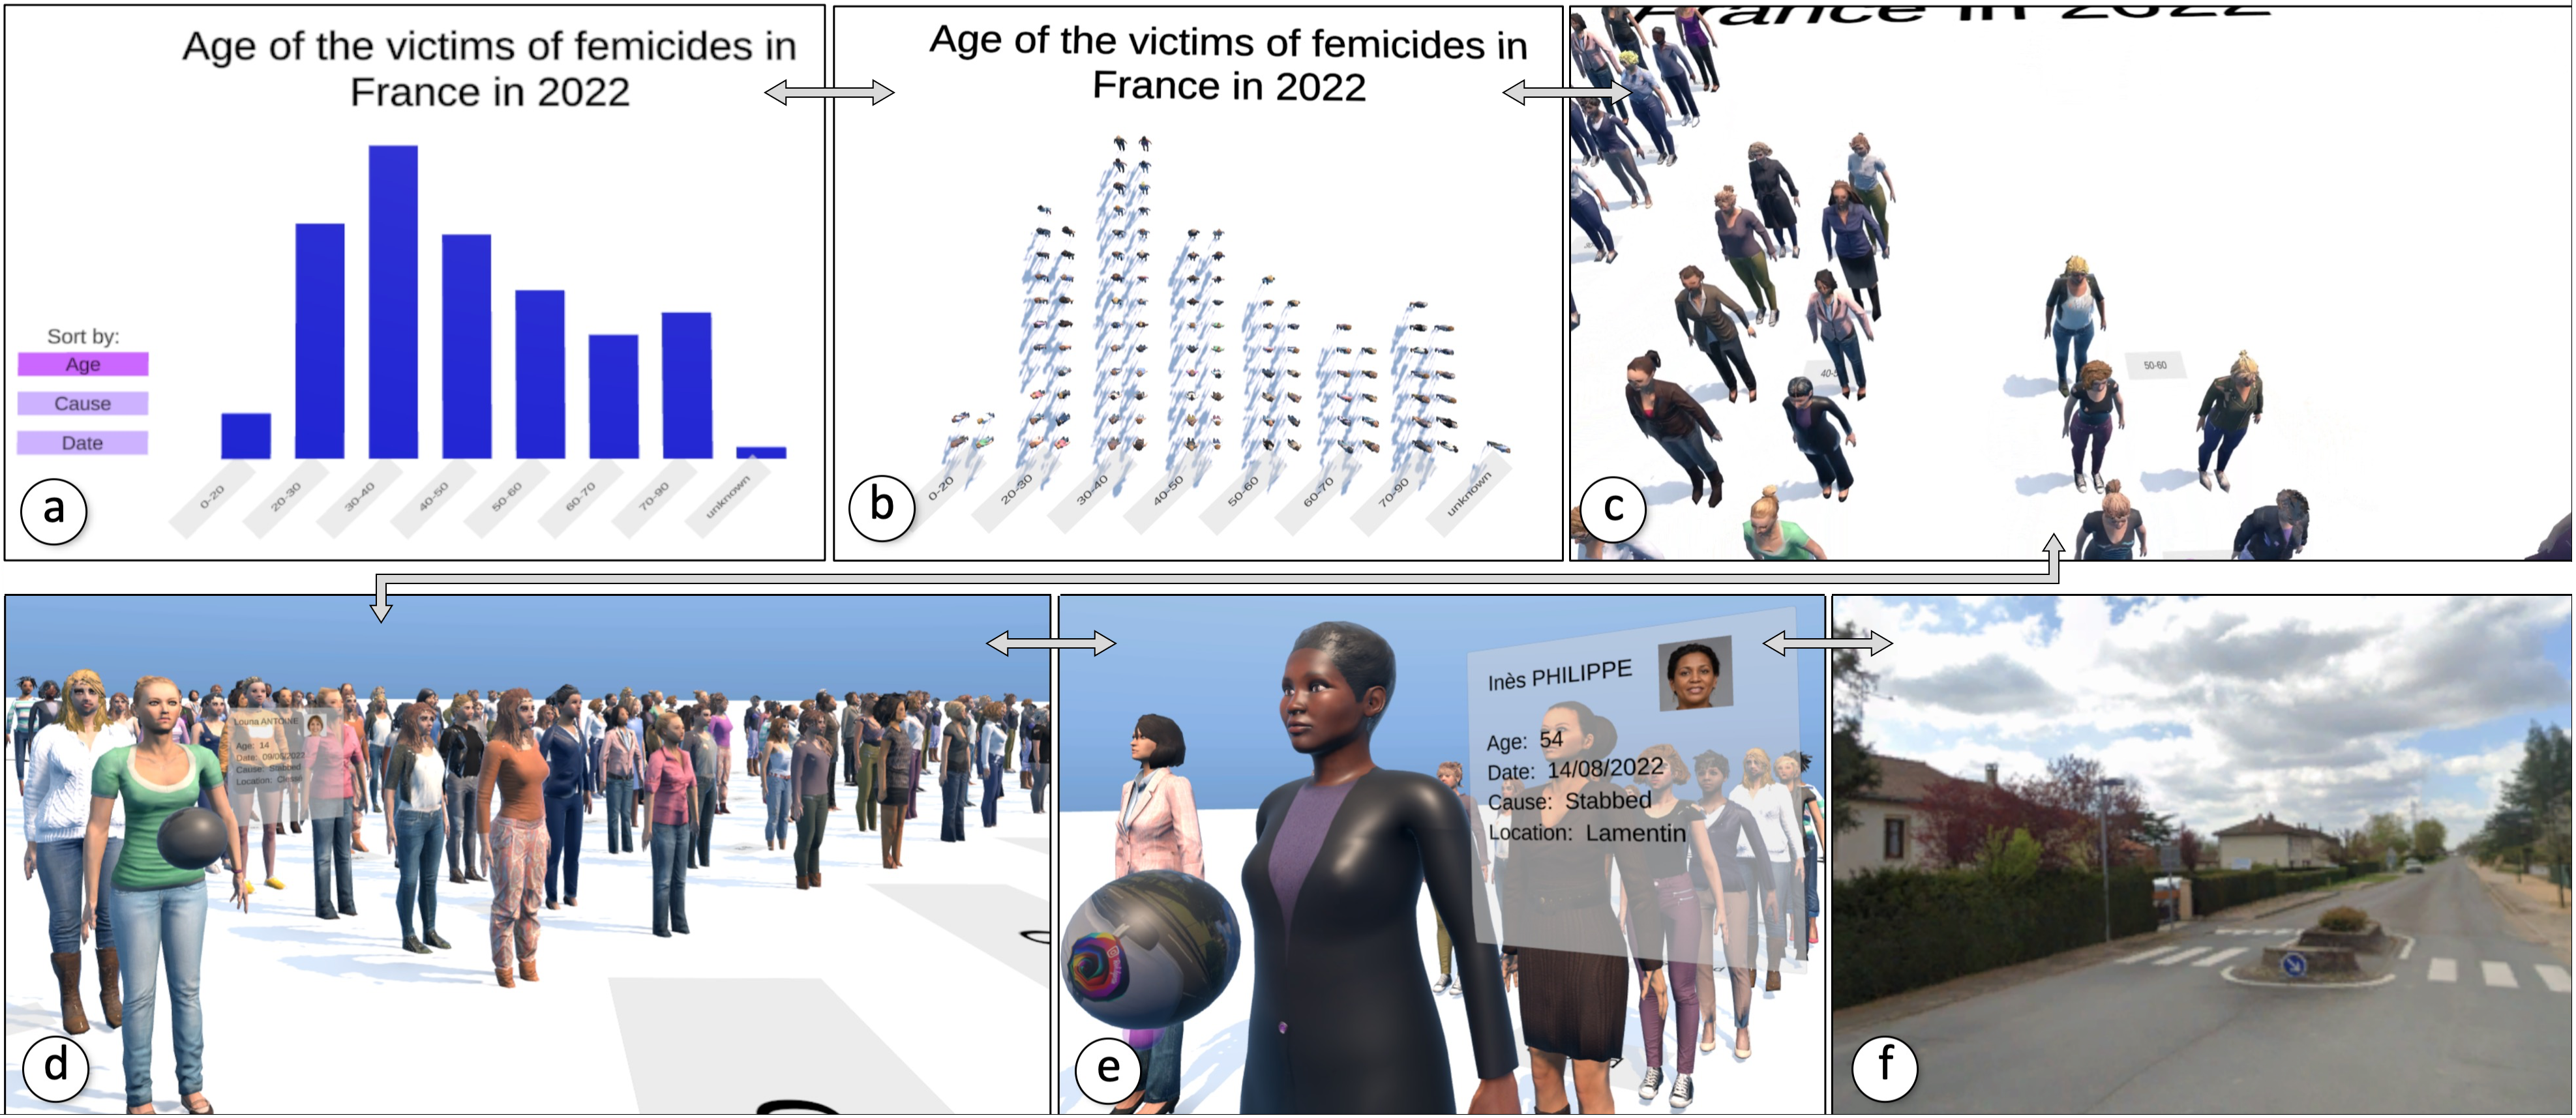
Screenshots of a zoomable empathetic visualization (ZEV) showing data about femicides at different zoom levels. (a) the initial view is a classic bar chart. (b) the bar chart turns into a unit chart where each victim is represented by a square ; squares then morph into 3D avatars viewed from the top. (c) the user ends up “landing” on the visualization, (d) finding themselves inside the crowd of femicide victims. (e) when the user approaches a particular victim, a box shows information about the victim. The user can grab the sphere next to the victim, in order to (f) immerse themselves into a 360° view of the neighborhood where the femicide took place. Names and photos have been changed.