Data Ribbons: Break the Frame and Unroll Data in the Air
Understanding the difference between small and big values spanning over several orders of magnitude can be difficult. In this paper, we introduce the concept of Data Ribbons, visualizations allowing people to playfully unroll the biggest values of a bar chart beyond its frame. While the smallest values appear as classic bars on a 2D canvas, participants are invited to pull a roll handle and to unroll ribbons representing the biggest values of the dataset. Ribbons are then unfolded in the space surrounding the participant. As a proof of concept and demo, we introduce AR Data Ribbon, an augmented reality Data Ribbon where the biggest bars unfold as a virtual ribbon. We hope our design could lead to a greater engagement, creative ribbon output patterns and better data understanding.

Publications
Project images
(click on any of the images for a high resolution version)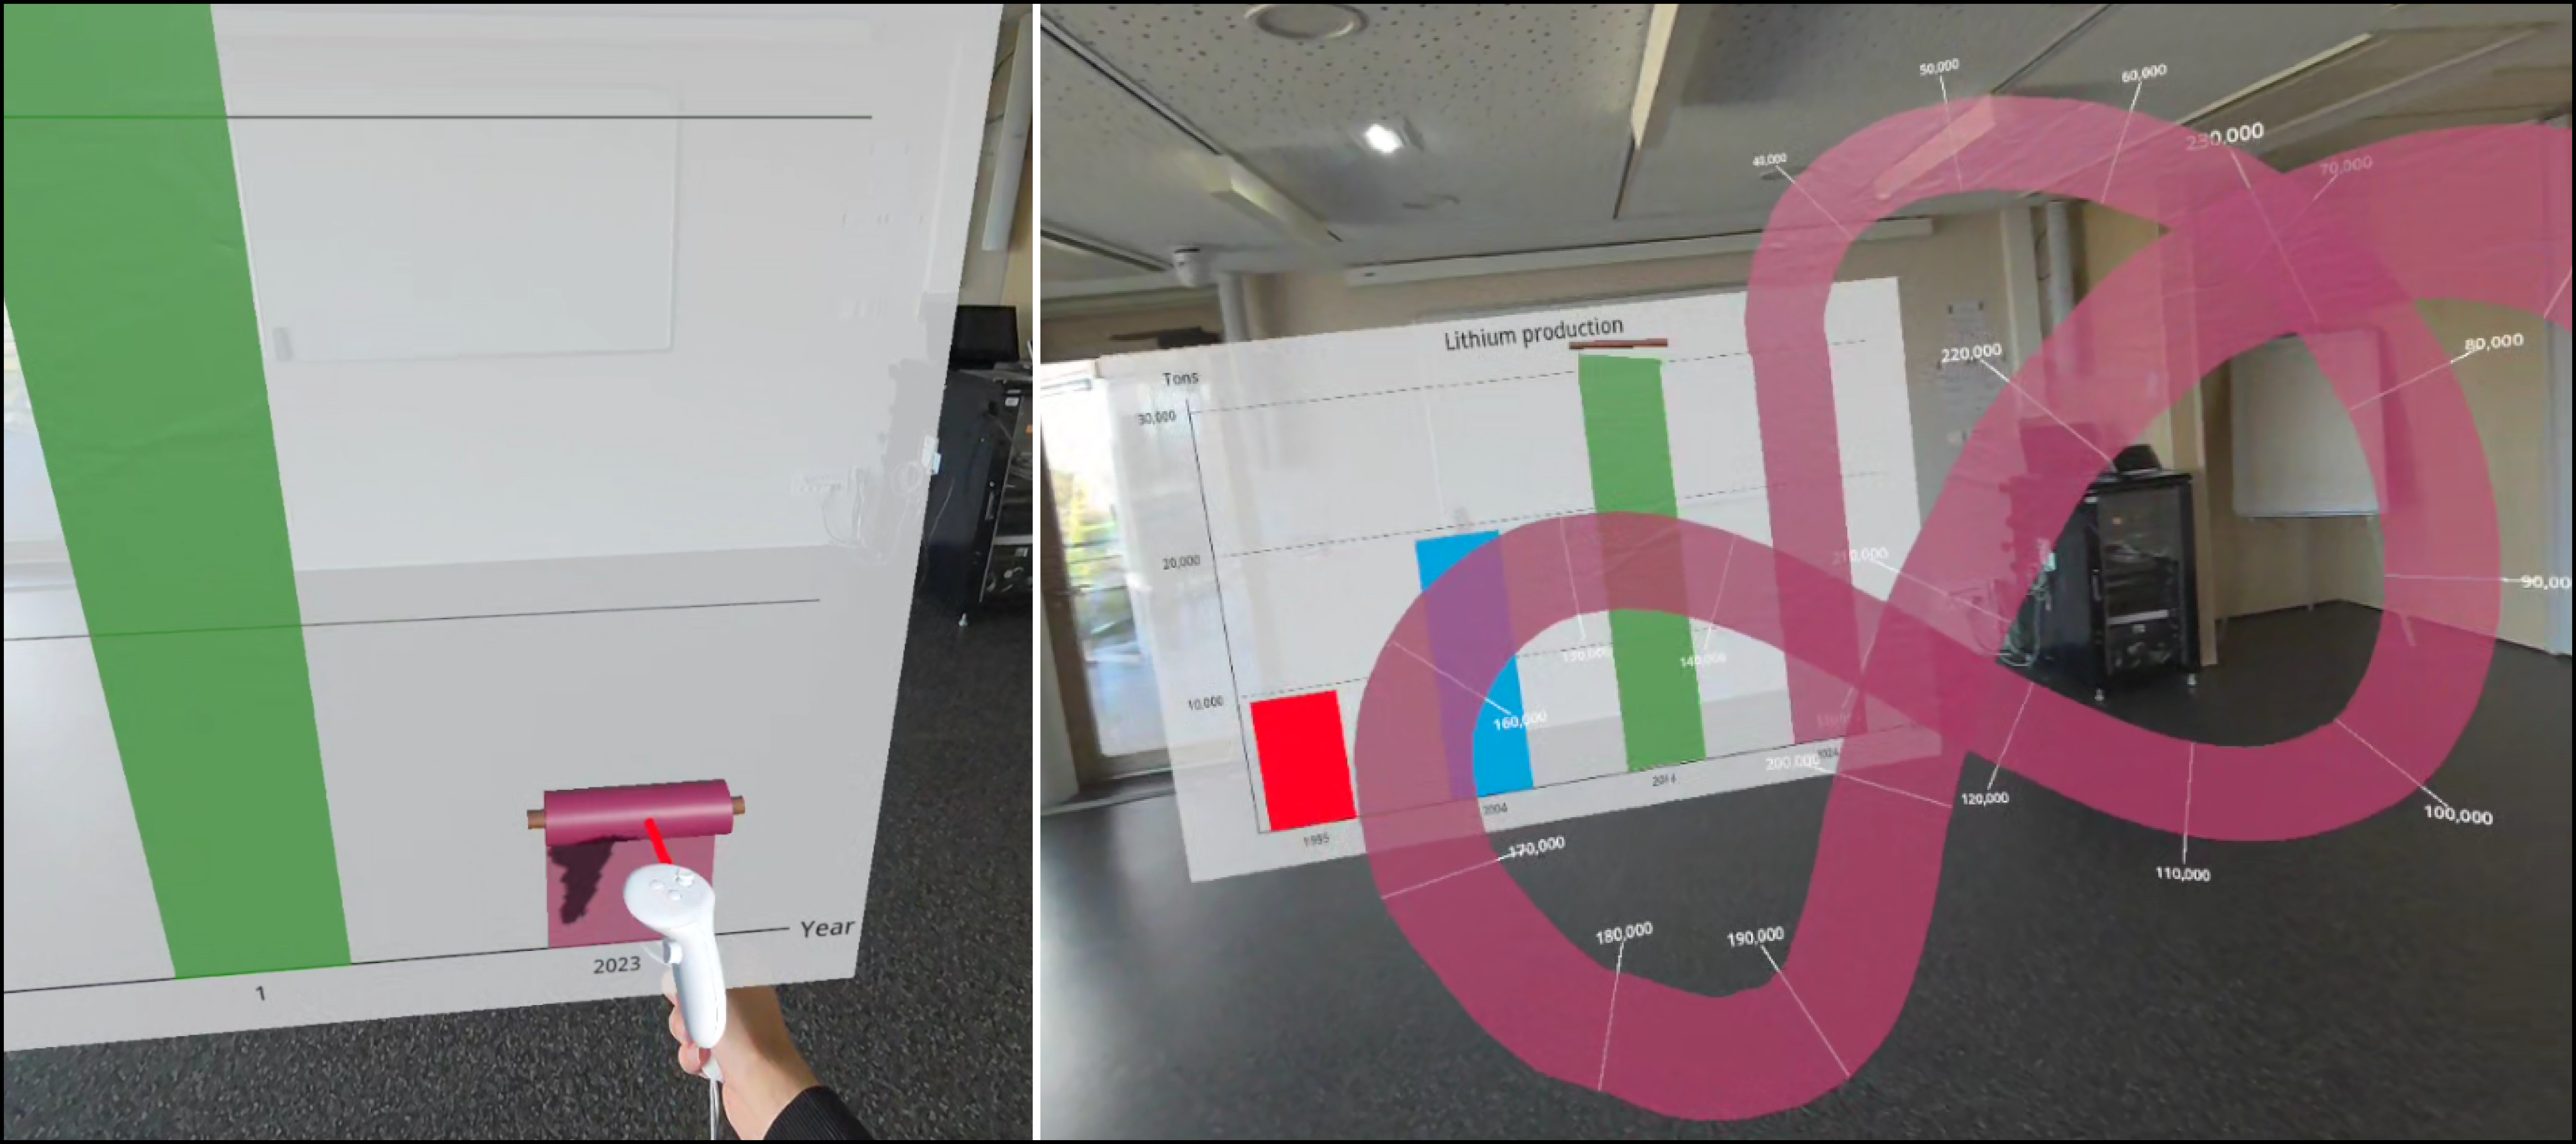
AR Data Ribbon maps the biggest value of a bar chart to a 3D ribbon unrolled by a user in any direction. Initially, the bar is displayed on a 2D frame (left) and it extends beyond the frame as the user is unrolling the ribbon (right).