AROM: Rambling Along Data in Augmented Reality to Explore Large Order of Magnitude Values
Understanding datasets containing values spreading over several orders of magnitude can be difficult for non-experts. In this position paper, we introduce the concept of AROM: augmented-reality visualizations scaled across several meters, inviting people to walk around the physical space to get a sense of differences in order of magnitude of the visualized data. After presenting three different examples of AROMs, we discuss challenges and future research opportunities.
Publications
Project images
(click on any of the images for a high resolution version)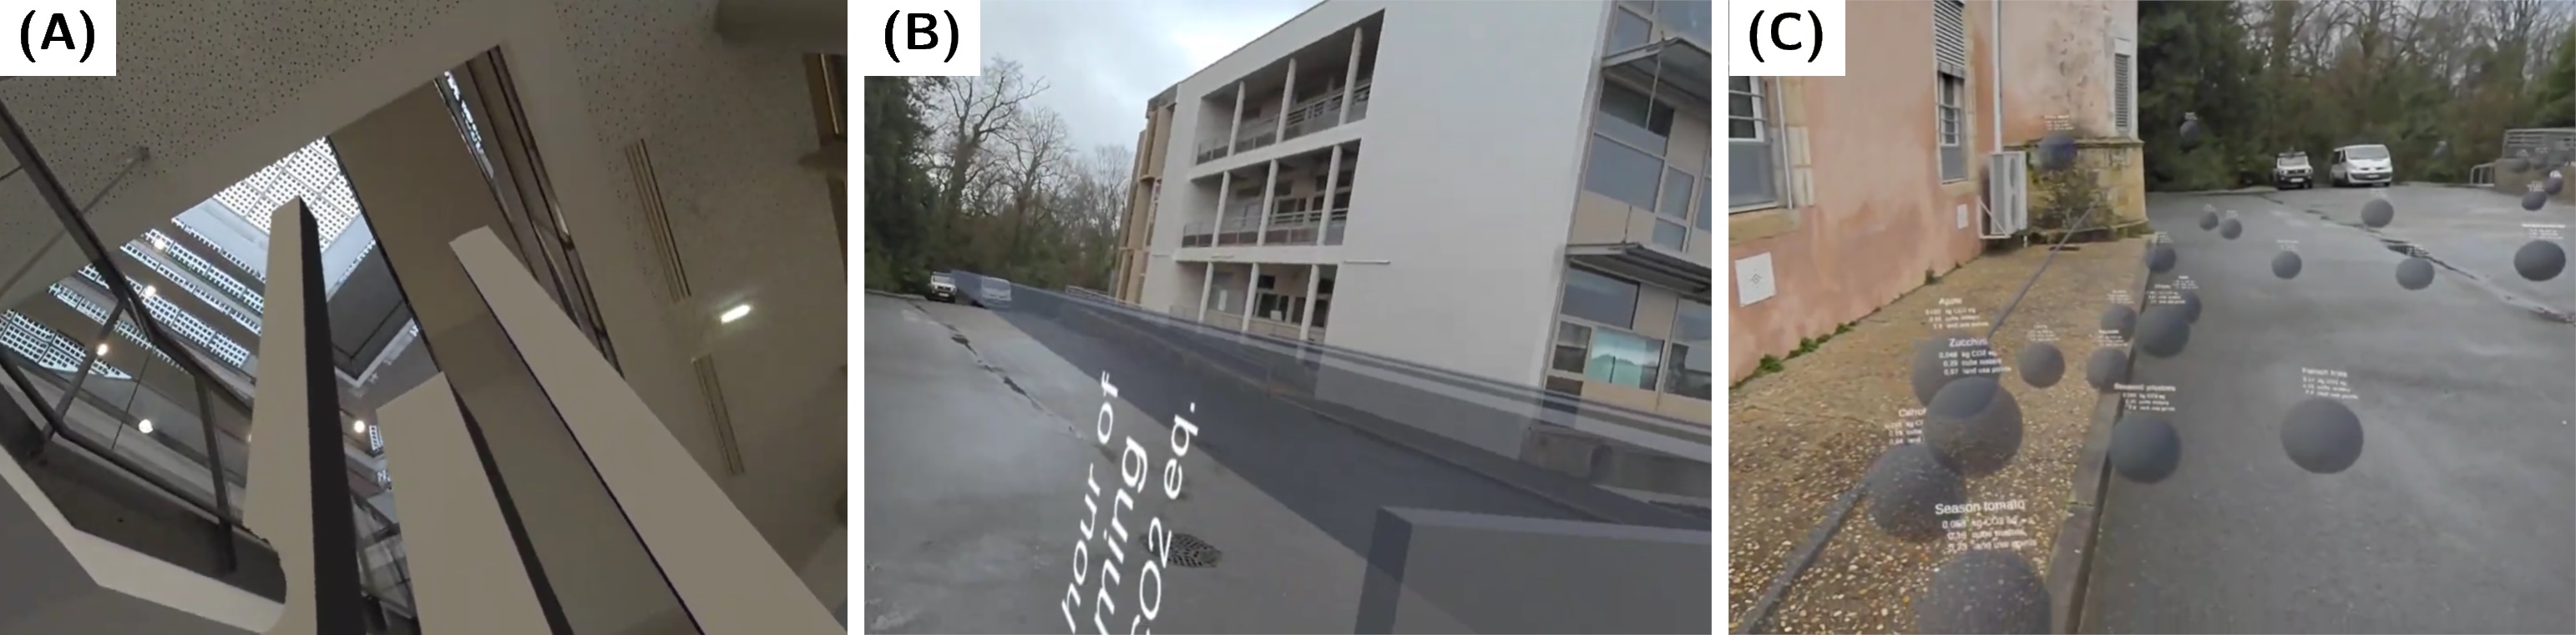
Three proofs of concept illustrating examples of AROMs: (A) is a 3D vertical bar chart displayed across several floors of an atrium, (B) is a 3D horizontal bar chart displayed across several meters on a parking lot and (C) is a 3D scatter-plot displayed across the width, depth and height of a parking lot.